That’s why it’s important to know how you can analyze your data. For example, you might want to find how many repeating numbers there are in a cell range—or how many unique numbers there are instead. If you want to know how to count unique values in Excel, follow the steps below.
How to Quickly Count Values in Excel
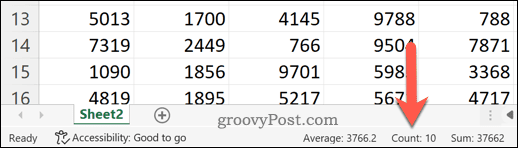
Do you need a way to quickly count the number of values that are in a data set in Excel? To be clear—this is the total number of values, not unique values. If you only need to know the number (but don’t want to interact with it in your spreadsheet), there’s a quick way to check. To do this, select the cells containing your values in your spreadsheet. With the cells selected, take a look at the bottom of your Excel window (below the sheet labels). You’ll see different calculations for you—including the value count. This counts the number of cells that aren’t empty.
While this doesn’t allow you to count the number of unique values, it does offer a quick way to check how many of your cells have a value versus the ones that don’t.
How to Count Unique Values in Excel Using SUMPRODUCT and COUNTIF
If you want to count unique values in Excel, the best way to do it is to use a formula. You can use a combination of the SUM and COUNTIF functions to do this. To quickly explain what these functions do, SUMPRODUCT will multiply and then return the sum of a data range. COUNTIF will count the number of cells in a range that match a condition. You can use both functions together to return the number of unique values for each cell in an array. For example, if you’ve got a list of numbers ranging from one to eight, but eight is repeated twice, the array returned will contain the value 1—other than where eight is listed, where it’ll return 2. That’s because the value 8 is repeated twice. To count unique values in Excel using SUMPRODUCT and COUNTIF:
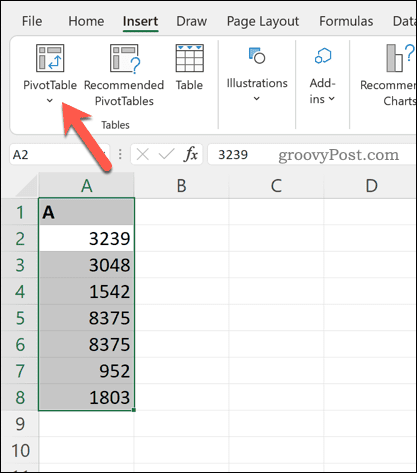
How to Count Unique Values in Excel Using a Pivot Table
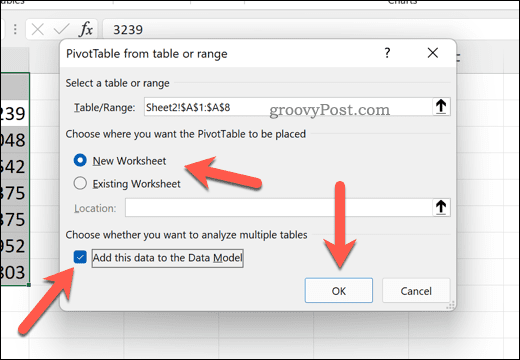
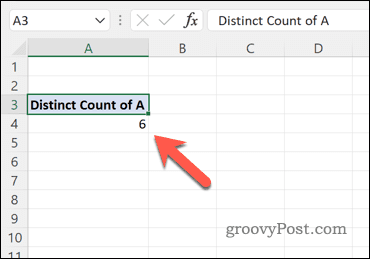
Another way to count the unique values in Excel is to use a pivot table. This allows you to analyze your data more closely. To count unique values in Excel using a pivot table: The Pivot Table will update to show you the total number of unique values in your data set.
You can configure your Pivot Table to change this further. For example, you may wish to break this value down by using sub-categories, depending on how your data is laid out in your spreadsheet.
Calculating Values in Microsoft Excel
Using the steps above, you can quickly count unique values in Excel. This is just one way you can use Excel to calculate, manipulate, and analyze different values. For example, you might want to calculate percentage increases or decreases using Excel—perfect for your financial planning. There are other formulas in Excel that you can use, from essential formulas like SUM to more advanced formulas like TRUNC. If you’re new to Excel, don’t forget to check out these essential Excel tips to get started. Comment Name * Email *
Δ Save my name and email and send me emails as new comments are made to this post.


![]()
